Overview
The tasks of this project were as follows: to become familiar with the Yolov8 computer vision model and to utilize its built-in capabilities to create a dataset that can distinguish between customers and employees. Customers are relatively simple for a computer program to distinguish from workers, as all workers wear a green hat. After attempting automatic labeling of ‘person’ objects wearing green hats, I achieved limited results. Consequently, I manually labeled around 441 image frames from CCTV footage and mirrored them to obtain a training set of 674 images.
The online try-out features of Roboflow allowed me to gauge the accuracy of the model, and I found that the dataset size delivered sufficient results to continue. Subsequently, I wrote a simple program to track the customer’s time in the store, using a certain margin of error to determine the time tracked for each customer. As a result, I was able to calculate the average time a customer spent in the store. Furthermore, I modified the algorithm to utilize the polygon feature in Yolov8 development, which is useful for understanding how many potential customers may only linger by the entrance but decide not to enter.
The Dataset
1.1 Training and Results
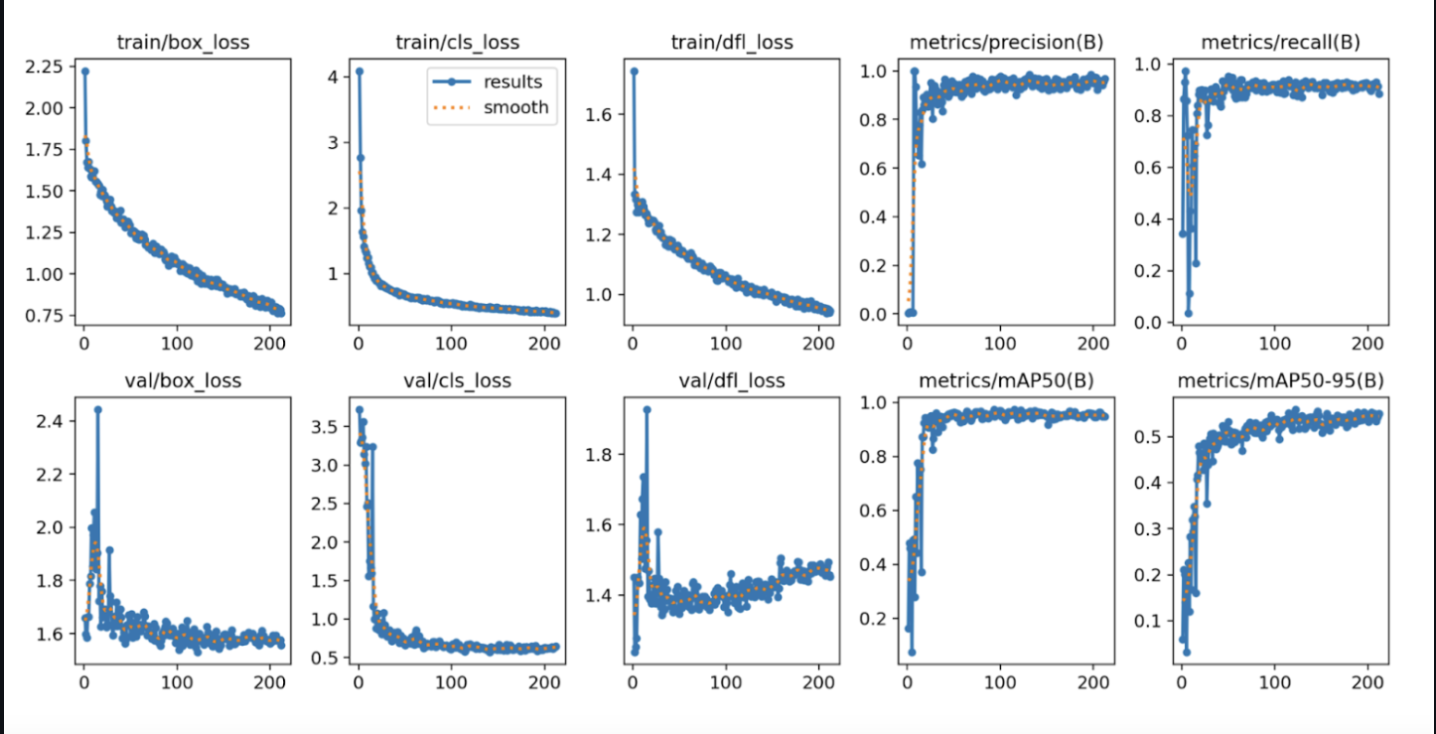
The dataset was created using Roboflow and Yolov8. The dataset proved to be more efficient than originally presumed, even given the limited amount of training data.
It achieved the following accuracies in training:
- Customer Detection with 88% accuracy.
- Worker Detection with 97% accuracy.
- Overall Accuracy: 92%.

Figure 1: Training graphs showing model accuracies.
1.2 Testing the Dataset and Examples
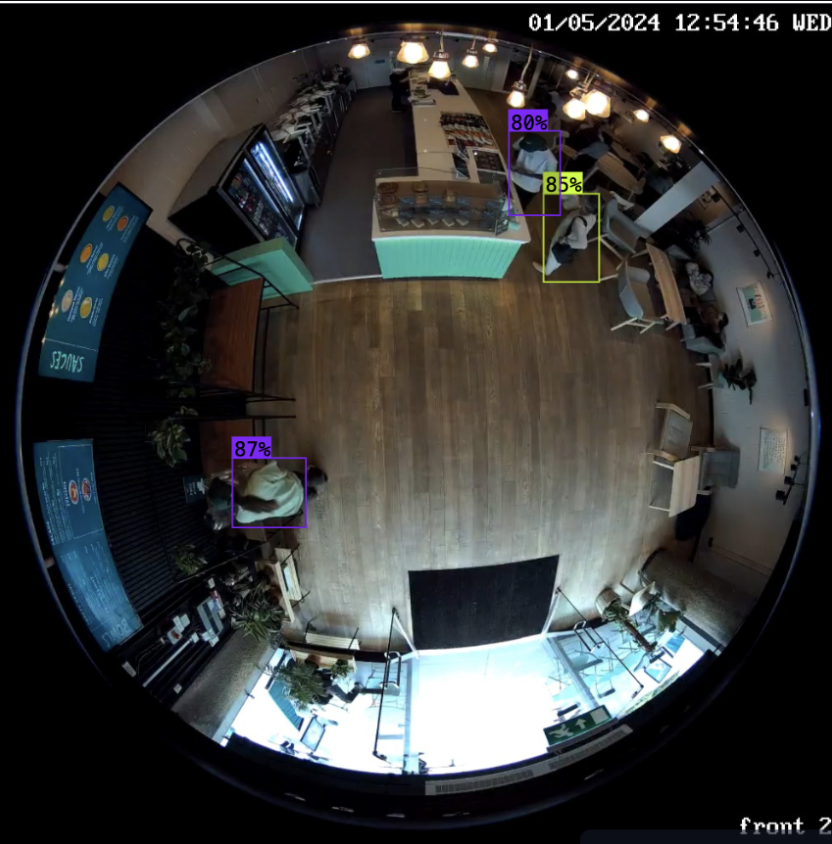
The testing results provided highly accurate labeling of 'persons' as either 'workers' (in purple) or 'customers' (in yellow). In the provided image, we can observe the respective accuracies of the estimates per frame, which tend to be mostly above 75%.

Figure 2: Example of labeled frames distinguishing customers from employees.
Similarly, displaying a video as a heatmap gave insights into the location within the store that customers frequent the most.

Figure 3: Heatmap showing customer presence in various store areas.
1.3 Average Time Spent in Store
The first algorithm developed attempts to make sense of the customer's time spent in the store. After conceptual analysis, the team decided that the algorithm was not beneficial for thorough analysis. Mainly, brief entries into the store (e.g., delivery workers or potential customers peeking in) would alter the averages drastically.
1.4 Conversion Rates
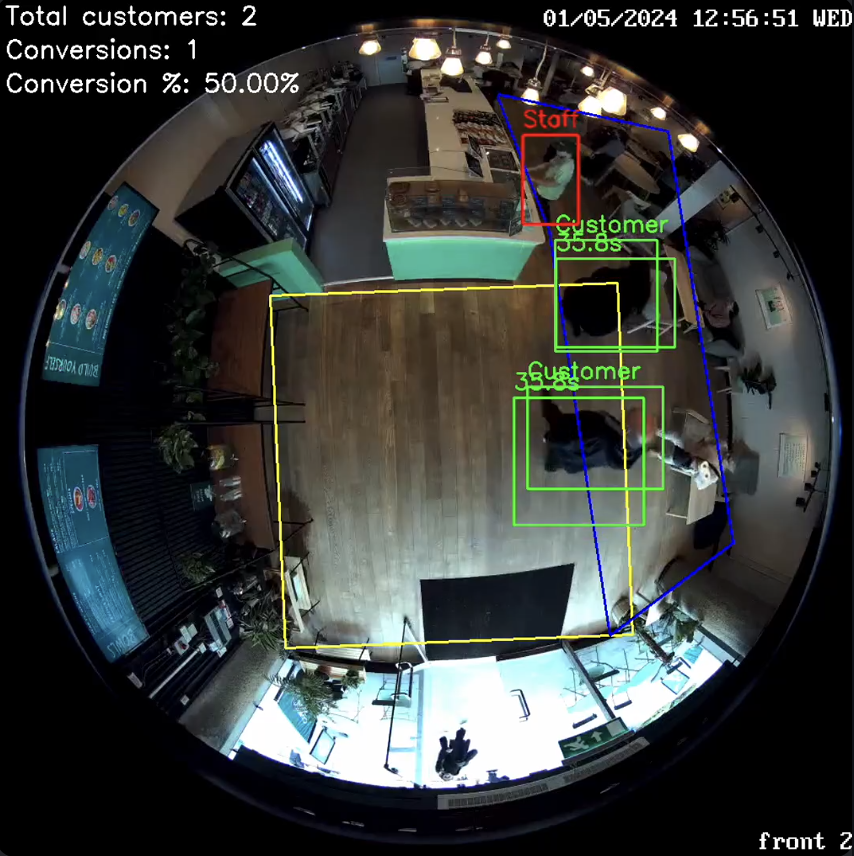
The conversion rate algorithm was developed to analyze the percentage of potential customers that enter the store. Two polygons were defined: one for tracking customers who entered the store and one for those who moved from the entrance to the store area, indicating a successful conversion.
Increasing this conversion rate could positively impact sales and customer traffic.

Figure 4: Conversion rate with polygon tracking.